
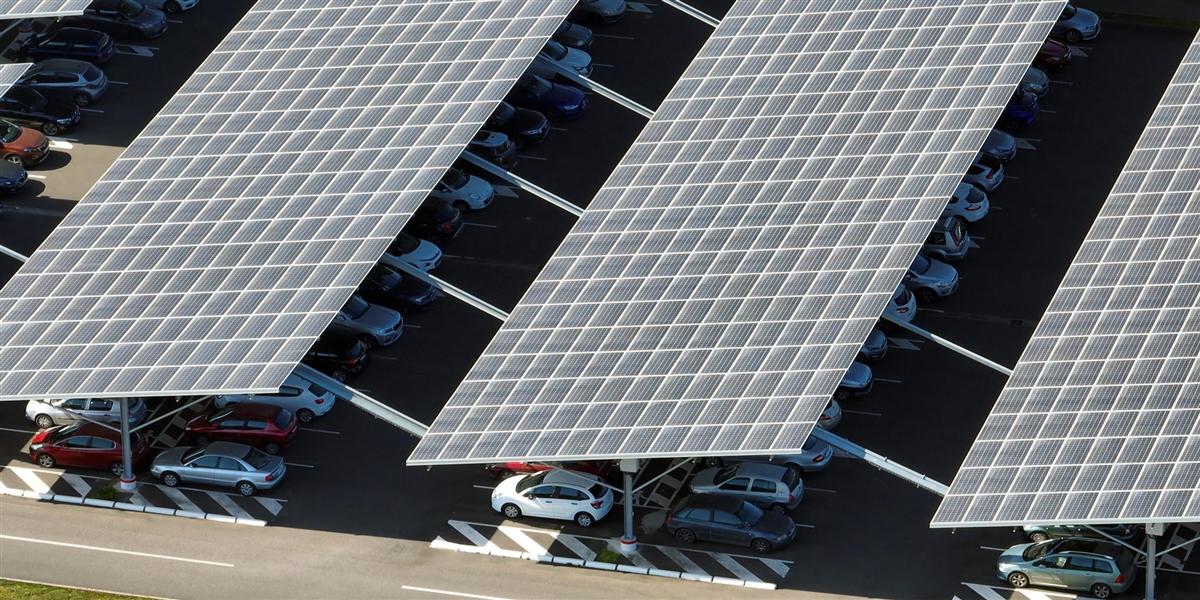
Integrated PV+Storage: Why MIDA 80kW Solar EV Charging is the Future
Quick Answer
An integrated PV+storage 80kW solar EV charging system combines the array, the battery, and the DC charging outputs in one engineered unit with a single energy management system. That integration is what turns solar charging from a partially effective daytime gesture into a reliable 24-hour energy service. An 80 kW DC station with 100 kWp of PV and 150–250 kWh of storage typically delivers 65–85% of its annual energy from sunlight, cuts the cost per delivered kWh to $0.08–$0.14 versus $0.20–$0.30 on grid-only charging, and reaches simple payback in 4–6 years — 2.5–4 years where incentives or high local tariffs apply. The economics work because integration removes conversion stages, removes coordination risk, and removes duplicated hardware.
Key Takeaways
- Integration is an efficiency strategy, not a packaging preference. A single DC bus across PV, battery, and charging modules lifts PV-to-vehicle efficiency to 92–95%, versus 85–88% for separately sourced AC-coupled systems.
- 80 kW is the crossover point at which a site can charge two vehicles at high power, absorb a commercially meaningful PV array, and still fit within a typical 200–250 A service.
- Storage sized at 1.5–2.5 kWh per kWp of PV raises solar self-consumption from 30–45% to 80–90%.
- Levelised cost of delivered energy for integrated PV+storage charging lands at $0.08–$0.14/kWh over ten years, compared with $0.20–$0.30/kWh for grid-only DC charging.
- One vendor, one EMS, one warranty is the procurement principle that determines whether the modelled savings are actually realised.

The Structural Problem With Unintegrated Solar Charging
A site that buys a PV array from one supplier, an inverter from a second, a battery from a third, chargers from a fourth, and a site controller from a fifth is not a solar charging system. It is a committee of devices. The symptoms are predictable and expensive.
Surplus energy is exported instead of used. Without storage and coordinated control, generation peaks at midday while vehicle demand peaks in the morning and evening. A 100 kWp array on a site with 80 kW of charging and no storage will export 40–60% of its output — typically at 20–40% of the retail value it displaces.
Conversion losses stack up. Each interface between separately supplied components adds a conversion stage. PV inverter (97.5%), AC bus and transformer (98%), battery bidirectional inverter (96% in, 96% out), charger rectifier (95.5%), charger output stage (97.5%) — the compounded PV-to-vehicle efficiency is 85–88% at best, and worse in practice.
Coordination failures cost more than hardware. When the charger, the battery, and the PV inverter each optimise independently, the site hits peak import when the battery should be discharging, or discharges when the tariff is cheap. Operators commonly capture only 55–70% of the savings their feasibility study projected, and the loss is attributable to the seams between vendors.
Maintenance complexity multiplies. Five vendors means five firmware update cycles, five warranty processes, five diagnostic portals, and no single party accountable when the site underperforms. For a fleet operator whose charging revenue depends on availability, that fragmentation has a direct cost.
What Integration Actually Changes
An integrated PV+storage 80 kW charging system collapses five boxes into one engineered architecture.
- A single DC bus. PV strings feed MPPT or DC/DC conversion directly onto a shared 1,000–1,500 V DC bus. The LFP battery connects through a bidirectional DC/DC converter. The charging output stage — multiple 20–40 kW wide-voltage modules — draws from the same bus and regulates to the vehicle’s pack voltage. Energy from sun to vehicle crosses one or two conversion stages instead of four.
- A single energy management system. One controller owns dispatch: it forecasts irradiance and vehicle arrivals, tracks tariff bands, respects battery state-of-health limits, coordinates power sharing between active sessions, and exposes the whole site to an OCPP 2.0.1 backend for billing and roaming.
- A single thermal and safety design. Liquid cooling serves the battery and the power modules within one thermal envelope, and the fire-suppression, isolation, and protection scheme is designed for the DC bus rather than assembled per device.
- A single accountability boundary. Performance guarantees on yield, availability, and efficiency come from one supplier, which is the only arrangement under which those guarantees are enforceable.
The practical difference is measured in delivered energy. For an identical array and an identical charging duty cycle, an integrated DC-coupled system will deliver 6–9% more energy to vehicles than an AC-coupled assembly of equivalent nameplate ratings, every year, for the life of the asset.

Sizing an 80kW Integrated Station
The table below is a practical design matrix for the 80 kW class, spanning workplace, retail, residential-community, and fleet depot profiles.
| Site profile | PV array | Usable storage | Storage converter | Daily charging energy | Solar share |
|---|---|---|---|---|---|
| Workplace commuter charging (day arrivals) | 90–110 kWp | 120–150 kWh | 80 kW | 250–350 kWh | 80–88% |
| Retail / hospitality (short dwell, all day) | 80–100 kWp | 150–200 kWh | 80–100 kW | 300–450 kWh | 72–82% |
| Residential community / condo (evening arrivals) | 100–130 kWp | 200–300 kWh | 80–100 kW | 200–350 kWh | 70–82% |
| Fleet depot, light commercial vans | 120–160 kWp | 250–400 kWh | 100–120 kW | 450–700 kWh | 62–75% |
| Weak-grid or resilience-critical site | 90–130 kWp | 250–400 kWh | 100 kW | 200–400 kWh | 68–80% plus backup |
Three sizing rules govern these numbers. Energy before power: storage must cover the interval between generation and demand, so evening-arrival sites need substantially more storage energy than midday-arrival sites at the same charging volume. Converter power at 80–100% of charger rating: if the converter is undersized, simultaneous sessions collapse the battery’s contribution and the site imports at peak. Worst-month irradiance, not annual average: a seasonal dip of 60–75% in winter generation is normal in temperate latitudes, and a design that ignores it will underdeliver for three months each year.
Levelised Cost of Delivered Energy: The Decisive Comparison
The clearest way to evaluate integrated PV+storage against alternatives is levelised cost of delivered energy (LCOE) over ten years, including capital, operations, replacement, and the cost of purchased energy. The model below assumes an 80 kW station delivering 300 kWh per day (109,500 kWh per year).
| Architecture | Capex | 10-yr energy cost | 10-yr O&M + augmentation | Total 10-yr cost | LCOE per kWh |
|---|---|---|---|---|---|
| Grid-only 80 kW DC charger | $62,000 | $246,000 | $28,000 | $336,000 | $0.307 |
| 80 kW DC + AC-coupled PV (no storage) | $158,000 | $168,000 | $42,000 | $368,000 | $0.336 |
| 80 kW DC + AC-coupled PV + AC-coupled storage | $236,000 | $92,000 | $74,000 | $402,000 | $0.367 |
| Integrated 80 kW PV+storage, DC-coupled | $205,000 | $64,000 | $66,000 | $335,000 | $0.306 |
| Integrated PV+storage with incentives (~30%) | $144,000 | $64,000 | $66,000 | $274,000 | $0.250 |
The result deserves attention: the integrated system lands at the same or lower LCOE as grid-only charging while supplying 65–85% of its energy from on-site solar, and it does so without relying on incentives. That equivalence is the core argument for integration. The AC-coupled configurations carry higher capex, higher losses, and higher maintenance, and they only outperform on narrow criteria such as retrofit convenience at sites that already own compatible hardware.
Two caveats are honest to state. First, LCOE comparisons are sensitive to local energy prices: in a market with $0.08/kWh industrial power, the gap between grid-only and solar-integrated narrows sharply, and storage becomes a demand-charge and resilience investment rather than an energy-cost one. Second, incentives shift the ranking but not the order — the integrated architecture benefits from incentives as much as any other, and typically more, because storage and PV portions of a single project are easier to document for programme eligibility.
Where Integration Pays Back Beyond Energy Cost
Energy cost is the easiest benefit to model and rarely the largest over a full asset life. Four additional value streams are structural to the integrated design.
| Benefit | Mechanism | Typical annual value (80 kW site) |
|---|---|---|
| Demand charge reduction | Storage shaves the charger’s contribution to the site peak | $14,000–$26,000 |
| Power-sharing and faster turnaround | Coordinated output keeps both bays at usable power instead of derating | One to two additional sessions/day |
| Resilience and uptime | Islanding keeps charging available during grid events | Avoided revenue loss; fleet continuity |
| Future grid-service revenue | Bidirectional-ready converter can participate in demand response | $3,000–$12,000 when markets exist |
| Reduced transformer or service upgrade | Peak management avoids a capacity increase | $40,000–$150,000 deferred |
That last line is frequently the largest single number in the business case. Sites whose service entrance cannot support 80 kW of additional charging load face a utility upgrade with long lead times. A storage-buffered integrated station often eliminates the need entirely, converting a two-year infrastructure project into a fourteen-week equipment deployment.
Engineering Details That Determine Real-World Performance
Wide-voltage output. Charging modules must span 200–1,000 V DC (and 1,500 V for heavy-duty vehicles) so the station serves the entire vehicle parc without derating. A module optimised only for 400 V-class packs will throttle on 800 V architectures, which are now standard in new premium and commercial vehicles.
Module granularity. The 20–40 kW module class allows an 80 kW station to use three or four independent modules, giving graceful degradation and field-replaceable maintenance. MIDA’s charging modules for EV applications follow this design philosophy, which is why the same module family scales from 60 kW carport stations to megawatt-class cabinets.
Liquid cooling. Sustained high-power operation at 45°C ambient requires liquid-cooled power stages and cables. Air-cooled designs derate precisely when charging demand is highest — at midday, when solar generation peaks and the site’s economics depend on delivering energy.
Battery chemistry and depth of discharge. LFP with a 10–90% operating window and 6,000–8,000 cycles at 80% depth of discharge delivers ten years of daily cycling before meaningful augmentation. Chemistry choice is therefore a financial decision with a decade-long consequence.
Protection and standard compliance. The DC bus needs coordinated isolation, arc-fault detection, and insulation monitoring, plus fire suppression sized for the battery enclosure. Compliance with IEC 62619 and UL 9540/9540A (North America), IEC 61851 and IEC 62196 for the charging interface, and local grid codes for the interconnection should be verified with documentation, not supplier assurance.
Communications and cyber security. OCPP 2.0.1 and ISO 15118 for charging; SunSpec/Modbus or equivalent for PV and storage assets; TLS-encrypted transport; signed firmware; and role-based access control. A solar charging site without hardened communications is a distributed energy asset exposed to the network.
Deployment Sequence for an 80kW Integrated Project
| Stage | Duration | Deliverable |
|---|---|---|
| Feasibility and interval-data analysis | 3–6 weeks | Load profile, tariff model, sizing recommendation, savings projection |
| Detailed design and grid notification | 6–10 weeks | Single-line diagram, protection study, permit submissions |
| Manufacture and factory acceptance | 8–14 weeks | Integrated unit assembled and load-tested as one system |
| Civil, electrical, and commissioning | 3–5 weeks | Energisation, islanding test, power-sharing verification |
| Dispatch optimisation | 6–10 weeks | Tuned cost function, verified billing cycle performance |
Total elapsed time for a standard site: 18–28 weeks. Where the site requires a grid upgrade, add 12–18 months — the strongest argument for sizing storage to avoid that path altogether.
Why MIDA’s Integrated Platform Is Built for This
MIDA Power develops the components that make integrated PV+storage charging possible under one engineering team: wide-voltage DC charging modules, DC charging cabinets from 60 kW to 240 kW, storage integration, and PV system components. Its reference architecture for zero-emission sites, the 200kWh solar BESS EV charging station, demonstrates the same principles at scale — a single DC bus, one EMS, PV and storage sized to the charging duty cycle. Operators evaluating the full portfolio can review MIDA’s charging solutions across portable, AC, and DC product lines, and where projects grow toward heavy-duty fleets, the platform extends to the 600kW–720kW liquid-cooled DC charging station for EV trucks and buses with the same control philosophy and the same module lineage.
FAQ
1. What does “integrated PV+storage” actually mean for an 80kW charging station?
It means PV, battery, and charging outputs share one DC bus and one energy management system inside one engineered system, rather than being sourced separately and stitched together on site. The result is fewer conversion stages, one control authority, one warranty, and measurably higher delivered energy for the same nameplate ratings.
2. How much does an integrated 80kW solar charging station cost?
As an installed system with 100 kWp of PV and 150–250 kWh of storage, expect $180,000–$250,000 before incentives, depending on storage capacity, connector mix, civil works, and market. Incentives in many jurisdictions reduce that by 20–40%.
3. How long is the payback period?
Simple payback typically lands at 4–6 years without incentives and 2.5–4 years with them, assuming 250–400 kWh per day of charging throughput and local energy prices above $0.15/kWh. Sites with high tariffs or expensive capacity upgrades see faster returns.
4. Is 80 kW enough power for two vehicles at once?
Yes. Two simultaneous sessions at 40 kW each, or dynamically shared output up to 80 kW on a single vehicle, covers typical passenger and light commercial duty cycles. A two-vehicle session at 40 kW each adds roughly 200 km of range per vehicle in an hour.
5. Why not just install a bigger PV array and skip the battery?
Without storage, midday generation is exported rather than delivered to vehicles, because charging demand rarely coincides exactly with the solar peak. Self-consumption without storage sits at 30–45%; with properly sized storage it reaches 80–90%. The battery is what converts generation into delivered, monetisable energy.
6. How does the system behave during a grid outage?
With islanding-capable control and sufficient storage, the station continues charging from PV and battery while the grid is down, then re-synchronises on restoration without interrupting active sessions. Island duration depends on storage capacity and load: 200 kWh supports roughly 2.5 hours at 80 kW, longer at reduced output.
7. What is the single most common cause of underperformance in these projects?
Fragmented procurement. When PV, storage, and charging come from different suppliers with independent controllers, the site cannot dispatch as one system, and realised savings typically fall 30–45% below projections. Specifying an integrated architecture with one accountable vendor is the most reliable protection of the investment case.
Post time: Sep-15-2026


