
Maximizing Profitability: ROI Analysis of BESS-Integrated Solar EV Charging Stations
Quick Answer
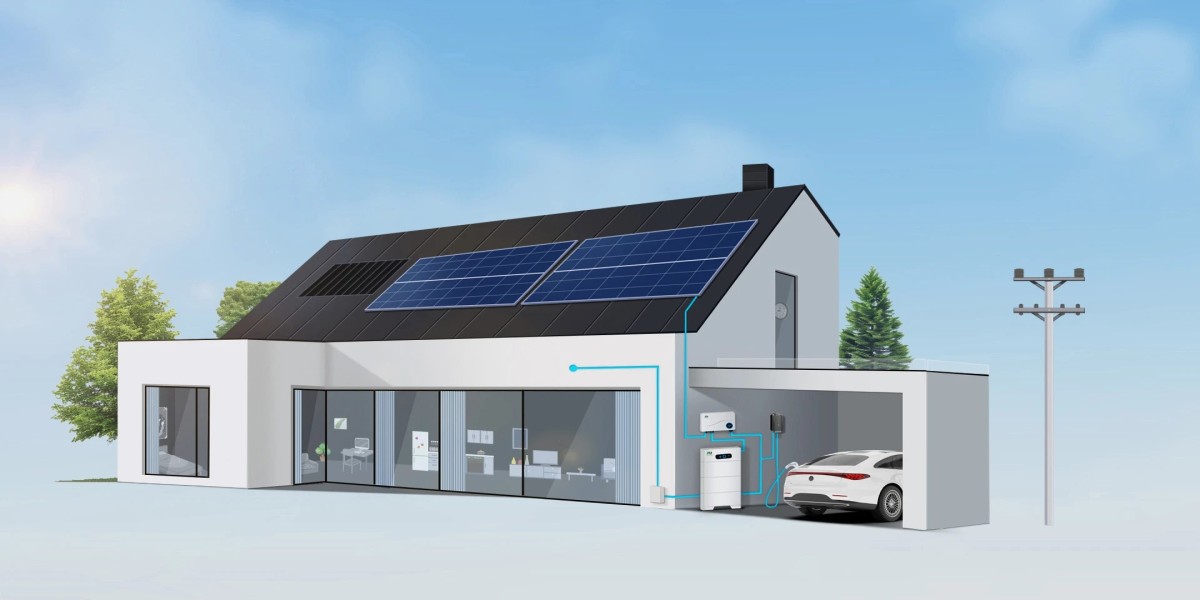
A BESS-integrated solar EV charging station combines on-site photovoltaic generation, a battery energy storage system (BESS), and DC fast charging under a single energy management controller. This architecture attacks the three cost drivers that keep conventional charging stations unprofitable: demand charges, high energy procurement prices, and grid-upgrade fees. In a typical commercial configuration — 200 kW of solar, 200 kWh of storage, and 240 kW of charging — operators can cut demand charges by 30–60%, lower energy costs through solar arbitrage, and add charging capacity without expensive transformer upgrades. Modeled ROI across European and North American tariff structures shows payback periods compressing from 8–10 years for grid-only stations to 3–6 years for solar-plus-storage systems, with internal rates of return in the 15–30% range.
Key Takeaways
- Demand charges, not electricity volume, are the biggest cost killer for public fast charging; BESS peak shaving is the most direct cure.
- Solar plus storage reduces the effective cost of energy delivered to vehicles from typical grid tariffs to $0.05–0.12/kWh depending on location and irradiation.
- One BESS asset generates multiple revenue streams: charging margin, peak shaving, solar arbitrage, and demand response payments.
- Grid-limited sites can add 2–4× more charging capacity without utility upgrade costs when storage decouples load from the connection point.
- Payback periods of 3–6 years are achievable when the system is sized against the site’s actual load profile rather than its nameplate power.
Why Most EV Charging Stations Struggle to Make Money
The EV charging business looks attractive on paper — growing vehicle fleets, rising energy demand, and supportive regulation — yet a large share of public charging stations globally operate at thin or negative margins. The reasons are structural, not operational.
First, utilization is low. Public fast chargers in early-adopter markets average 10–20% utilization, meaning each stall earns revenue only 2–5 hours per day. Second, energy costs are unpredictable. Commercial and industrial electricity tariffs include demand charges — fees based on the highest 15-minute power draw in a billing month — that can account for 30–60% of a charging site’s total electricity bill. A bank of 240 kW chargers that all happen to draw power simultaneously during an evening peak can spike the site’s demand charge for the entire month.
Third, grid capacity is expensive. Connecting a multi-stall high-power site often requires a transformer upgrade, which in many utility regions costs $50,000–$250,000 and takes 12–24 months. Fourth, charging margins are compressed by competition: retail per-kWh prices are visible and comparable, so operators cannot simply pass costs through to drivers.
The BESS-integrated solar model exists to fix precisely these four problems. Storage flattens the load profile and kills the demand-charge penalty. Solar generates energy at near-zero marginal cost that can be sold at retail charging prices. And because the battery buffers the site’s grid draw, operators can install more charging capacity behind an existing connection — converting a grid constraint from a cost into a business advantage.
What Is a BESS-Integrated Solar EV Charging Station?
The architecture is straightforward, but the engineering is where value is created. A complete system has four components:
Photovoltaic array. Roof-mounted or carport solar panels sized to the site’s daytime energy profile. For a typical charging hub, 100–300 kW of PV provides meaningful daytime generation without requiring excessive land.
Battery energy storage system (BESS). Lithium-iron-phosphate (LFP) battery packs sized in energy (kWh) and power (kW) to match the site’s peak-shaving and arbitrage needs. The BESS charges from solar during the day and from cheap grid energy at night, then discharges to cover charging load during expensive peak periods.
DC fast charging equipment. One or more high-power chargers — for example, a 240 kW or 480 kW liquid-cooled station — whose load is managed by the energy controller rather than left to draw whatever it wants from the grid.
Energy management system (EMS). The intelligence layer that forecasts solar output, tracks charging demand, monitors real-time electricity prices, and decides in each 15-minute interval whether the station buys from the grid, discharges the battery, or curtails charging load. The EMS is the difference between a pile of hardware and a profitable asset: it optimizes against the tariff structure continuously, not once at design time.
This is not a theoretical arrangement. Integrated solar-plus-storage charging stations are operating commercially across Europe, Australia, and the United States, and the component economics improve every year as battery pack prices decline toward $80–100/kWh and module efficiency rises.
Revenue Streams and Cost Levers: Where the Money Comes From
| Profitability Lever | Mechanism | Typical Impact |
|---|---|---|
| Charging margin | Sell energy to drivers at retail; source it from solar + off-peak storage | Gross margin improves $0.05–0.15/kWh vs. grid-only |
| Demand charge reduction | BESS shaves the monthly peak; EMS staggers charger starts | 30–60% reduction in demand charges |
| Solar self-consumption | PV covers daytime charging load directly | Effective energy cost $0.02–0.06/kWh at midday |
| Time-of-use arbitrage | Battery charges off-peak, discharges on-peak | $0.05–0.12/kWh spread captured |
| Demand response / grid services | Utility pays for dispatchable capacity during grid events | $20–80/kW-year in participating markets |
| Capacity expansion without grid upgrade | Storage decouples peak draw from connection limit | Avoids $50k–250k transformer costs |
The table underlines the core insight: each lever is individually modest, but they compound. A station that earns an extra $0.10/kWh on margin, avoids $2,000/month in demand charges, and skips a $150,000 transformer upgrade is a fundamentally different business from a grid-only station selling the same number of kilowatt-hours.
ROI Model: A Realistic Worked Example
To make the analysis concrete, consider a commercial site in a mid-latitude market (Southern Europe or the US Southwest) with strong tariffs for peak shaving. Assumptions are deliberately conservative:
Site configuration: 200 kW PV array, 200 kWh / 100 kW LFP BESS, one 240 kW DC fast charger (two stalls), grid connection 150 kVA.
| Item | Grid-Only Station | BESS + Solar Station |
|---|---|---|
| Capital cost (equipment + installation) | $120,000 | $320,000 |
| Annual energy delivered | 400,000 kWh | 400,000 kWh |
| Average retail charging price | $0.45/kWh | $0.45/kWh |
| Effective energy cost | $0.22/kWh | $0.13/kWh |
| Gross energy margin | $92,000 | $128,000 |
| Annual demand charges | $24,000 | $9,600 |
| Grid upgrade cost (one-time) | $120,000 (deferred via loan) | $0 |
| Operating & maintenance cost | $15,000 | $20,000 |
| Annual net operating income | $53,000 | $98,400 |
| Simple payback period | 8–9 years | 3.3 years |
| 10-year net present value (at 8% discount) | ~$85,000 | ~$280,000 |
Two qualifications are essential. First, the grid-only station in this model only avoids the transformer upgrade by accepting a 150 kVA limit, which caps simultaneous charging power — in practice, that constraint alone pushes operators toward storage. Second, the BESS numbers assume 300 cycles per year, a 10-year battery life, and $0.08/kWh average arbitrage spread plus solar savings; all are within current market norms for LFP systems.
The pattern holds across tariff structures: in markets with high demand charges (common in the US, the UK, and parts of Germany and Australia), storage pays for itself through peak shaving alone. In markets with strong solar irradiation and weak demand charges, the PV array carries more of the burden. Either way, the payback range of 3–6 years for integrated systems — versus 8–10+ years for grid-only stations — is what is driving institutional capital toward solar-plus-storage charging assets.
How Peak Shaving and Solar Arbitrage Move the Payback Curve
The economics hinge on one operational habit: charging the battery when energy is cheap and discharging when it is expensive. In a time-of-use tariff with a $0.08/kWh off-peak price and a $0.25/kWh on-peak price, a 200 kWh battery that cycles once daily captures roughly $34/day in arbitrage value — more than $12,000/year — before touching a single charging session. Add the demand-charge reduction (in this example, $14,400/year) and solar self-consumption, and the storage asset is earning its keep on three fronts simultaneously.
Peak shaving deserves special attention because it is the largest and most reliable lever. Demand charges are calculated from the single highest 15-minute draw each month, so a single unlucky spike — three vehicles arriving at once after a grid event — can cost more than a whole month of careful operation. The EMS solves this by forecasting load, throttling chargers during the critical window, and discharging the battery to cover the gap. Modern controllers can shave 30–60% of peak demand on a well-designed site, and every kilowatt shaved is a permanent monthly saving.
Solar arbitrage adds a fourth dimension. Rather than exporting midday solar surplus to the grid at feed-in tariffs of $0.02–0.08/kWh, the system stores it and sells it to drivers at $0.35–0.55/kWh. The spread between export price and charging price is the single most valuable kilowatt-hour in the entire asset — which is why battery size should be chosen to maximize self-consumption of the PV array, not to meet a generic “solar + storage” ratio.
Demand Response and Grid Services: The Hidden Revenue Layer
In an increasing number of markets, a BESS at a charging site is eligible for grid services revenue that grid-only stations cannot access. Operators can bid battery capacity into demand response programs, frequency regulation markets, and capacity markets — getting paid to stand ready to discharge or to avoid drawing power during grid events.
Typical compensation ranges from $20–80 per kW per year in mature markets, which on a 100 kW dispatchable battery adds $2,000–8,000 annually. More importantly, the station becomes a grid asset rather than a grid burden: utilities are measurably more cooperative with site owners whose storage helps manage local constraints. For fleet and commercial sites, this also unlocks lower connection fees in some jurisdictions, as the utility prices the connection on expected peak draw rather than nameplate capacity.
These revenue streams should be treated as upside, not as the foundation of the business case — program rules change, and dispatch availability is not guaranteed. But for operators comparing a grid-only station against an integrated system, they further widen a gap that is already decisive.
Design Decisions That Make or Break the ROI
The difference between a 3-year payback and a 7-year payback is usually decided at the specification stage. The decisions that matter most:
- Size storage against the load profile, not the charger’s nameplate. A 480 kW charger rarely draws 480 kW for hours. Model the actual session pattern, the tariff structure, and the PV output, then size the BESS to shave the realistic peak. Oversizing storage wastes capital; undersizing leaves demand charges on the table.
- Match battery power to charger power. A 100 kW BESS cannot fully back a 240 kW charger during a grid event. Either size the battery power closer to the charger load, or configure the EMS to throttle charging during the shaving window — the combination of both is standard practice.
- Specify liquid-cooled, high-availability charging hardware. The charging equipment is the revenue engine; a 98%+ availability station with a 480 kW liquid-cooled architecture earns materially more than an air-cooled alternative at the same site. See our analysis of liquid-cooled DC fast charging for the full comparison.
- Integrate EMS, billing, and telemetry from day one. OCPP 2.0.1-compliant charging equipment, a battery controller that talks to the EMS, and a billing platform that exposes per-session energy costs are the software spine of the asset. Retrofitting integration later is disproportionately expensive.
- Plan for the connector transition. North American sites should specify NACS-capable dispensers; European and Asian sites, CCS2. Dual-protocol cabinets protect resale value and future utilization.
On the hardware side, proven components exist today: 480 kW ultra-fast liquid-cooled charging stations designed for motorway deployment, modular 40–60 kW liquid-cooling power modules that keep the power stack serviceable for a decade, and integrated 240–360 kW liquid-cooled stations with RFID, OCPP, and POS for unattended operation. Pairing these with a BESS from the same vendor simplifies integration, warranty, and spare-parts management — a real cost that is often invisible in component-level quotes.
Frequently Asked Questions
1. What does BESS-integrated solar EV charging station mean?
It is a charging site where photovoltaic panels, a battery energy storage system, and DC fast chargers are combined under one energy management controller. The battery stores solar energy and cheap off-peak grid energy, then supplies the chargers during expensive peak periods.
2. How much does a solar-plus-storage EV charging station cost?
A typical commercial system — 200 kW PV, 200 kWh BESS, and a 240 kW charger — costs approximately $250,000–400,000 installed, depending on location, civil works, and grid connection requirements. Component prices have fallen sharply as battery pack costs approach $80–100/kWh.
3. What is the payback period for a BESS-integrated charging station?
Under current tariff structures in most European and North American markets, integrated systems achieve payback in 3–6 years, versus 8–10+ years for grid-only stations. The exact figure depends on demand charges, solar irradiation, and utilization.
4. How does a BESS reduce demand charges at a charging site?
The energy management system forecasts the site’s peak demand, throttles chargers during the critical 15-minute window, and discharges the battery to cover the load — cutting the monthly peak by 30–60% and permanently reducing demand charges.
5. Can battery storage increase charging capacity without a grid upgrade?
Yes. Because the battery buffers peak draw, a site with a 150 kVA connection can support 240–480 kW of charging capacity by leveling the load. This avoids transformer upgrade costs of $50,000–250,000 and 12–24 month utility lead times.
6. What battery technology is used in charging station storage?
LFP (lithium iron phosphate) is the standard choice for EV charging applications due to its 5,000–8,000 cycle life, thermal stability, and cost. Battery systems are typically sized at 200–1,000 kWh for commercial charging hubs.
7. Can an existing grid-only charging station be retrofitted with solar and storage?
In most cases, yes. Solar carports can be added above existing stalls, and containerized BESS units can be installed adjacent to the site. The EMS integration and any connection-rule changes are the main engineering work — and the payback math improves exactly as it does for new sites.
MIDA Power supplies integrated high-power charging and storage solutions. Explore our DC fast charging product range, including 480 kW liquid-cooled stations for motorways, 40–60 kW liquid-cooling power modules, and 360 kW liquid-cooled stations with RFID, OCPP, and POS.
Post time: Aug-20-2026


