
Maximizing Site Efficiency with 960kW Ultra-Fast Split DC Charging Clusters and Smart Sharing
Quick Answer
A 960kW split DC charging cluster — typically four 240kW liquid-cooled power cabinets feeding 8–12 dispensers — is the highest-efficiency configuration for busy charging sites because it maximizes the two levers that drive revenue: dispenser utilization and energy throughput. With dynamic smart sharing, the 960kW power pool is allocated in real time so that a low-SoC vehicle can draw 240–350kW while a nearly full vehicle tapers, lifting average utilization from the 40–60% typical of fixed allocation to 85–95%. For a motorway service area or urban truck hub processing 150–300 sessions per week, that difference converts to 30–60% more energy sold through the same cabinets — and, at 2026 electricity tariffs, a payback period shortened by 12–18 months. Smart sharing also flattens peak demand, protecting the site from grid penalties and enabling a smaller, cheaper grid connection.
Key Takeaways
- 960kW clusters aggregate four 240kW (or equivalent) liquid-cooled cabinets into one shared power pool with 8–12 dispensers.
- Dynamic smart sharing lifts utilization to 85–95% and site energy throughput by 30–60% versus fixed allocation.
- Millisecond-level load limiting prevents breaker trips and cuts peak-demand charges — typically 15–30% of total electricity cost.
- Liquid cooling sustains full output at 40°C+ ambient, protecting revenue during summer peaks.
- The same cluster can serve passenger EVs, vans, and heavy trucks, adapting allocation to each vehicle’s acceptance curve.
Site Efficiency = Utilization × Power × Time
Charging site profitability reduces to one equation: revenue equals the energy you actually deliver, which equals utilization multiplied by available power multiplied by operating time. Most site operators obsess over the middle term — total installed kilowatts — because it is the visible number in the CAPEX budget. But the lever that actually moves EBITDA is utilization: the fraction of available power that is dispatched into vehicles over a given window. A 960kW site running at 50% utilization sells the same energy as a 480kW site at 100% — at roughly double the capital cost and double the standing losses.
The uncomfortable truth from real operating data is that fixed-allocation sites — where each dispenser is hard-wired to a capped share of power — structurally cap utilization below 60% as soon as vehicle arrival patterns become uneven, which they always do. A queue of three vehicles at one dispenser group while another group idles is not a scheduling failure; it is the inherent behavior of static power rights. The fix is architectural, not operational: pool the power and let software arbitrate. That is precisely what a 960kW split cluster from MIDA Power delivers, and it is why “smart sharing” has moved from marketing phrase to bankability requirement in 2026 project finance.
What a 960kW Cluster Looks Like
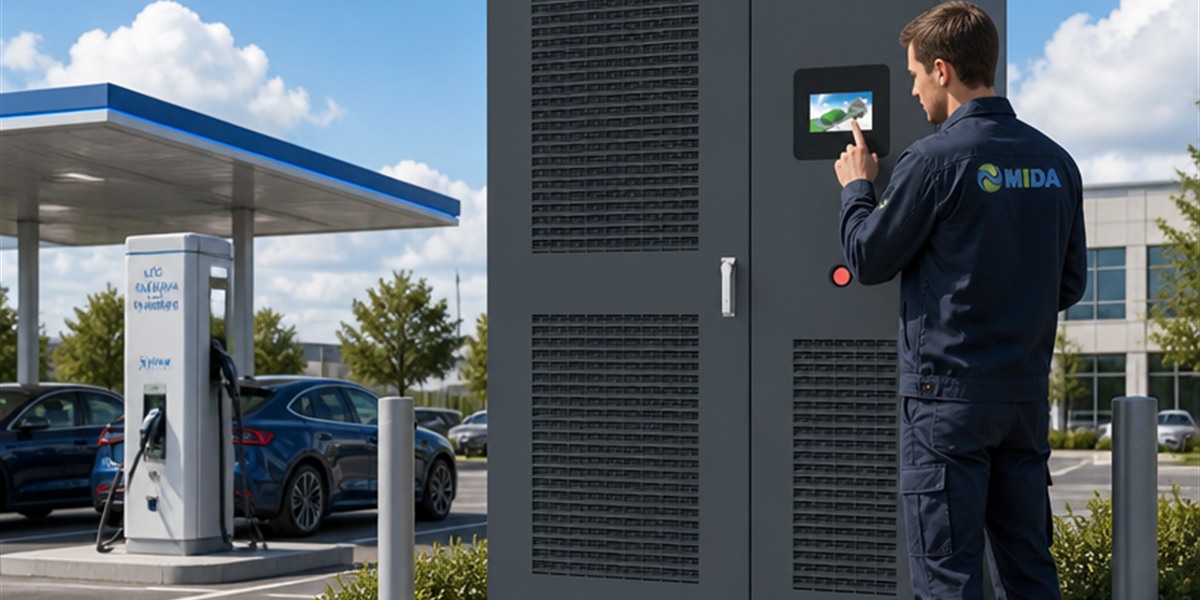
The canonical 960kW configuration is four 240kW liquid-cooled cabinets, one site controller, and eight to twelve dispensers distributed across two to four bays. Alternative builds include two 480kW power rooms or a mix of 240kW and 360kW cabinets; the common thread is that no dispenser owns power — all power is pooled.
| Build option | Cabinets | Dispensers | Bays | Best site type |
|---|---|---|---|---|
| 4 × 240kW | Four 240kW liquid-cooled | 8–12 | 4–6 double-sided bays | Motorway service areas |
| 2 × 480kW pair | Two 480kW power blocks | 8–12 | 4–6 | Urban truck hubs, high-traffic plazas |
| 240 + 360 + 360kW | Three cabinets (mixed) | 8–10 | 4–5 | Phased expansions with existing gear |
Each cabinet houses hot-swappable 40–60kW liquid-cooling power modules, which is the operational detail that matters most: when one module fails, the controller sheds 40–60kW, the remaining 900kW keeps flowing, and a field swap restores full capacity within the hour. At 960kW scale, this module-level redundancy is what separates an “availability event” from an outage.
How Smart Sharing Actually Works
Smart sharing is often described as “power balancing,” which undersells the intelligence involved. Modern site controllers execute a real-time allocation loop that considers four inputs simultaneously: each vehicle’s maximum acceptance rate (from the battery management system via the charger’s communication stack), its current SoC taper curve, the queue depth at each dispenser group, and the site’s hard power cap from the grid connection.
The allocation logic runs on a millisecond cadence. When a truck arrives at 8% SoC and requests 350kW, the controller pulls power from dispensers whose vehicles are in taper (typically shedding 50–70% of their allocated share without the driver noticing any slowdown in their top-up), concentrates it on the new arrival, and re-spreads the pool as each session progresses. The practical result: a 960kW site can deliver a 350kW session and a 200kW session simultaneously while still servicing two 100kW sessions — peak throughput that a fixed 120kW-per-dispenser layout could never approach.
The second layer of intelligence is predictive load management. The controller knows the site’s import limit, the battery buffer state, and the tariff windows, so it can pre-cool (i.e., pre-charge the buffer) during low-tariff periods and discharge during peaks. This is what turns a charging site from a passive load into an active grid asset — and, increasingly, a revenue stream in flexibility markets.
The Queueing Math: Fixed vs. Shared Power
The utilization gap between fixed and shared allocation is not a matter of tuning; it is structural, and it can be quantified. Consider a 960kW site with eight dispensers. Under fixed allocation, each dispenser is capped at 120kW. If three trucks arrive wanting 350kW, two of them wait behind bays that are delivering only 120kW — the site’s peak capability is stranded behind a configuration choice. Under smart sharing, those same three trucks receive 240–350kW each, and the queue clears in roughly a third of the time.
| Metric (8-bay, 960kW site, 200 sessions/week) | Fixed allocation | Smart sharing |
|---|---|---|
| Peak per-dispenser power | 120kW | Up to 350–480kW |
| Average dispenser utilization | 45–60% | 85–95% |
| Weekly energy delivered | ~21–28MWh | ~38–45MWh |
| Average queue wait at peak | 25–40 min | 8–15 min |
| Peak demand charge (est.) | 100% baseline | 65–80% of baseline |
The revenue consequence is decisive: at €0.35/kWh retail minus €0.12/kWh energy cost, the shared site earns roughly €7,000–8,000 more gross margin per week — over €350,000 per year from the same cabinets. That is the difference between a 3-year and a 5-year payback on the identical hardware investment.
Demand Management and Grid Penalties
Peak demand charges are the hidden tax on poorly managed charging sites. In many European and North American markets, the demand charge (based on the highest 15-minute average import) constitutes 15–30% of total electricity cost — often more than the energy itself. Unmanaged charging makes this worse: when a shift change triggers eight simultaneous charging starts, the site’s 15-minute peak spikes, and the penalty is paid for the entire following year.
A 960kW cluster with smart sharing mitigates this in three ways. First, the controller staggers session starts (soft-start ramping) so simultaneous connections never create a coincident peak. Second, load-limiting caps site import at the contractual level — the breaker never trips, because power is shed gracefully from taper sessions before the limit is reached. Third, with an optional battery buffer of 300–600kWh, the site can shave its peak entirely, importing at a steady 600–700kW while delivering 960kW pulses to vehicles. Sites that implement all three typically cut their demand charges by 35–50%, which on a 960kW facility is often €40,000–80,000 per year.
Heat, Noise, and Installation Efficiency
Site efficiency is not only about electricity; it is also about how quickly a site can be built and how quietly it runs. Split architecture scores on both axes. All waste heat — roughly 4–6% of throughput, i.e., 40–60kW of thermal load at 960kW — is concentrated in the power room, where it can be ventilated or recovered, instead of radiating into driver waiting areas. Dispensers emit essentially no noise, which matters for night-time operation near residential zones and for motorway service areas with strict acoustic limits.
Installation efficiency follows the same logic: one power room, one earth grid, one fire-rated enclosure, and simple plinths at each bay. Field experience with MIDA’s split deployments shows construction timelines 20–30% shorter than equivalent all-in-one layouts, because the high-voltage work is centralized and the bay work is purely low-voltage DC distribution. For operators racing to capture traffic ahead of competitors, those weeks of schedule advantage translate directly into revenue.
Measuring Success: The KPIs That Matter
Once a 960kW cluster is live, operators should track five KPIs to verify the efficiency story is real:
| KPI | Target range | Why it matters |
|---|---|---|
| Dispenser utilization | 85–95% at peak windows | Directly drives revenue per installed kW |
| Energy per dispenser per day | 350–500kWh | Measures throughput per bay |
| Peak demand charge share | <20% of electricity cost | Validates load management |
| Availability | >98.5% monthly | Protects corridor SLAs and driver trust |
| Module MTBF / MTTR | >50,000h / <1h | Confirms liquid-cooled module economics |
If utilization sits below 70% after the first month, the likely causes are configuration (allocation too coarse), placement (dispensers not matching traffic flows), or tariff structure — all fixable within a shared-architecture system, and all near-impossible to fix in a fixed-allocation design.
Who Should Deploy 960kW Today
The 960kW sweet spot fits four site archetypes: motorway service areas expecting 150+ sessions per week; urban freight hubs serving last-mile and regional electric vans; truck-stop operators preparing for 2027 AFIR heavy-duty requirements; and fleet depots that want to monetize spare capacity to visiting vehicles. For each archetype, the cluster’s flexibility is the deciding factor: the same 960kW pool that delivers 350kW to a long-haul truck at 06:00 can service eight passenger EVs at 120kW each during the mid-morning shopping window, with zero reconfiguration.
Operators should also note that 960kW is the natural staging point toward megawatt capacity: the same four-cabinet cluster, site controller, and dispenser network extend to 1,200–1,440kW by adding cabinets. Specifying the controller and trenching for that future today costs little and preserves the option to serve the heavy-truck wave without a second construction project. MIDA’s own 480kW motorway-class deployments demonstrate the same architecture at smaller scale, and the 360kW liquid-cooled stations with RFID, OCPP, and POS provide the shared-software platform that makes clustering seamless.
The Bottom Line
Installed kilowatts do not make money; dispatched kilowatts do. The 960kW split DC cluster exists to maximize dispatch: pooled power, module-level redundancy, millisecond allocation, and predictive load management that together lift utilization to 85–95% and cut demand charges by a third or more. For any site expecting sustained multi-vehicle traffic, it is the configuration that reconciles the grid connection you can afford with the revenue you need to earn. Insist on three specifications in your tender: true dynamic sharing (not per-cabinet allocation), hot-swappable liquid-cooled modules, and a site controller with API access — then watch the utilization numbers carry the business case.
FAQ
1. How many dispensers can a 960kW split cluster support? Typically 8–12 dispensers across 4–6 bays. The dispenser count is chosen for traffic flow, not power; with smart sharing, a 960kW pool comfortably serves 12 dispensers because simultaneous full-power draws are rare and the controller arbitrates.
2. What is the difference between power sharing and smart sharing? Basic power sharing splits a cabinet’s output statically among connected vehicles. Smart sharing reallocates power dynamically every few milliseconds based on each vehicle’s request, SoC taper, queue depth, and site power limits.
3. Can a 960kW site charge a heavy truck at 350kW while serving cars? Yes. That is the core advantage of the pooled architecture: a low-SoC truck can draw up to 350kW (or more with higher-rated dispensers) while remaining capacity services passenger EVs at moderate power, all under the same site power cap.
4. How much can smart sharing reduce peak demand charges? Operators typically report 35–50% reductions in demand charges when combining soft-start ramping, load limiting, and a modest battery buffer — often €40,000–80,000 per year on a 960kW site.
5. What happens when a power module fails in a 960kW cluster? The site controller sheds 40–60kW of load and reroutes power; charging continues uninterrupted. A hot-swap replacement restores full capacity within about an hour, keeping availability above 98.5%.
6. Do I need a battery buffer to run a 960kW cluster? No, but it is strongly recommended where grid connection capacity is constrained or demand tariffs are high. The cluster runs fine on a 960kW import; the buffer simply lets you buy a smaller connection and shave peaks.
7. How long does it take to build and commission a 960kW site? With a ready grid connection, typical timelines are 6–10 weeks from civil works to energization for a split design, versus 8–14 weeks for equivalent all-in-one layouts, because high-voltage work is centralized in a single power room.
Post time: Aug-21-2026


